


Understanding and interpreting aviation weather charts is a foundational skill for pilots engaged in cross-country flight planning. Unlike local pattern work or short-distance hops, cross-country flights introduce greater variability in terrain, weather systems, and enroute decision points. This article is designed to serve as a comprehensive guide on how to utilize key weather charts—surface analysis, prognostic (prog) charts, radar summaries, and satellite imagery—to prepare for cross-country operations effectively.
Whether you're a student pilot preparing for a checkride or a seasoned instrument-rated aviator dispatching from a Part 135 operation, this guide will help you leverage weather data to make more informed, confident flight planning decisions. It builds upon a foundational understanding of decoded METARs and TAFs, which provide vital station-level forecasts, and complements structured NOTAM analysis that ensures route and airspace awareness. Together, these resources form a complete toolkit for weather-aware cross-country planning.
Why Weather Chart Literacy Matters
Weather-related incidents remain a leading contributor to general aviation accidents. While the technology available to pilots has improved dramatically—think integrated EFB apps, real-time radar overlays, and graphical TAF displays—the foundation of smart decision-making remains in the pilot’s ability to read and interpret raw aviation weather data.
Charts offer more than just graphical eye candy—they represent vetted, systemic observations and forecasts from NWS and FAA meteorologists. When interpreted correctly, these charts can help pilots avoid deteriorating weather, turbulence, icing, and convective activity.
Key Weather Charts for Cross-Country Planning
Here’s an overview of the primary charts you should evaluate as part of your preflight weather briefing:
1. Surface Analysis Chart
- Depicts real-time pressure systems, fronts, and precipitation.
- Useful for understanding prevailing weather and likely developments.
- Issued every three hours and valid at the time of observation.
Reading Tips:
- H/L symbols indicate high/low pressure centers.
- Isobars represent pressure gradients—closely spaced isobars suggest stronger surface winds.
- Front symbols (cold, warm, occluded) guide expectations for ceiling, wind, and visibility changes.
External Link: NOAA North America Surface Analysis Chart
Scenario Example: Planning a morning departure from KBOI to KSEA? A surface chart showing an approaching cold front may prompt a review of TAFs for sudden wind shifts or ceilings dropping below VFR.

Example of Surface Chart on May 19, 2025, 1800 UTC Source: NOAA
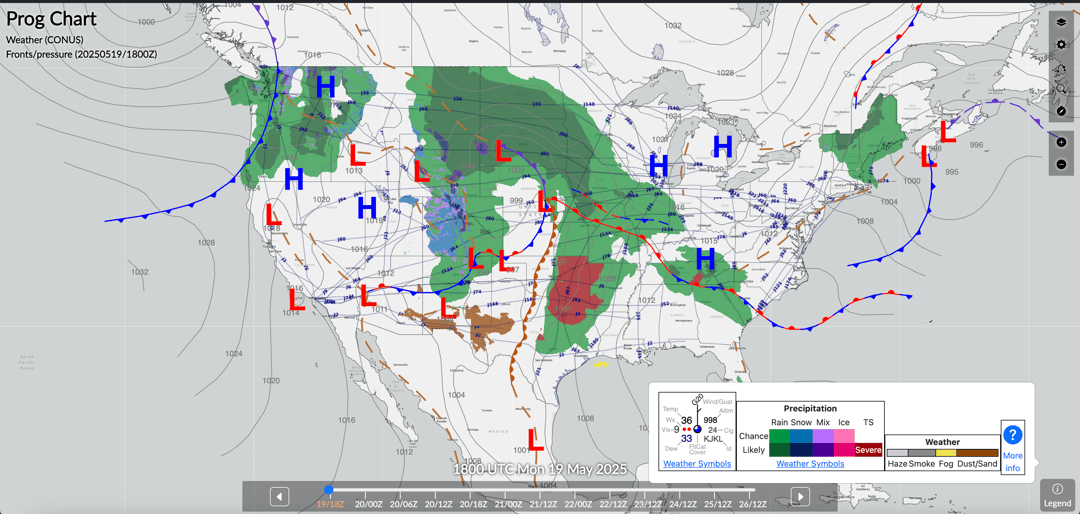
2. Low-Level Significant Weather Prognostic (Prog) Charts
- Forecast weather patterns from surface up to FL240.
- Issued in 12-, 24-, and 48-hour formats, often as outlooks for broad planning.
Key Elements:
- Shaded areas indicate IFR or MVFR conditions.
- Dashed lines outline areas of moderate turbulence.
- Jet stream overlays sometimes present in high-level versions.
External Link: Quick Weather Prognostic Chart Legend
Interpretation Tip: Combine low-level prog charts with TAFs and AIRMETs for cross-verification of forecast accuracy.

Example of Prog Chart on May 19, 2025, 1800 UTC Source: NOAA
3. Radar Summary Charts
- Provide near-real-time radar data, showing precipitation intensity, movement, and type.
- Often more granular than surface or prog charts and updated hourly.
What to Look For:
- Echo tops for assessing vertical development.
- Cell movement vectors for tracking storm drift.
- Hatched areas for significant reflectivity and convection.
External Link: Radar Summary - Weather Underground
Practical Example: Spotting rapidly growing convective cells near your route from KMSP to KOMA? Use this chart to time your departure or consider rerouting south to avoid embedded thunderstorms.

Example of Radar Chart on May 19, 2025, 1800 UTC Source: NOAA
4. Satellite Imagery
- Complements radar with visual cloud depiction, especially when radar returns are limited (e.g., in dry environments).
- Differentiates between low and high cloud layers.
Satellite Types:
- Infrared (IR): Detects cloud tops and night operations.
- Visible (VIS): Useful during the day for cumulus development.
- Water Vapor: Shows upper-level moisture content and jet stream dynamics.
External Link: NOAA Satellite Imagery
Chart Suggestion: Add a four-panel image showing VIS, IR, radar, and surface chart for the same area/time to illustrate the composite decision-making process.

Example of Infrared Satellite Chart on May 19, 2025, 1800 UTC Source: NOAA
When to Use Each Chart: Preflight Planning Timeline
Using these charts at the correct times during your planning cycle ensures you're working with the most relevant data. Here’s a breakdown:
|
Time Before Flight |
Charts to Review |
Purpose |
|
24–36 hours |
Long-range prog charts, GFA outlooks |
Macro-level route selection, early alternates |
|
12–18 hours |
Surface analysis, 24-hour prog |
Confirm major frontal/weather systems |
|
6–8 hours |
12-hour prog, updated METARs, radar/satellite imagery |
Validate earlier forecasts |
|
1–2 hours |
Radar summary, convective outlooks, satellite |
Tactical planning and go/no-go decision |
Visual Suggestion: Insert a timeline graphic mapping each weather product to its corresponding planning phase.
Interpreting Symbols and Patterns: Converting Data Into Decisions
Aviation weather charts are symbolic languages. Proficiency means being able to extract operational relevance from this data.
Surface Analysis Pattern Recognition
- Cold Fronts: Often bring gusty winds, embedded convective activity, and post-frontal clear skies.
- Stationary Fronts: Risk of stratiform precipitation and extended marginal weather.
- Isobars: Orientation can hint at wind flow and pressure changes enroute.
Prog Charts in Context
- Always read in conjunction with TAFs and area forecasts.
- Identify regions of MVFR/IFR and turbulence overlapping your route.
- Use as justification for routing amendments or fuel stop placement.
Using Radar and Satellite Together
- Radar indicates precipitation—not clouds.
- Satellite detects clouds—not necessarily precipitation.
- Cross-referencing the two confirms if a system is producing rain, snow, or just overcast skies.
Digital vs. Paper Charts: Efficiency Meets Redundancy
EFBs (Electronic Flight Bags) have become integral to modern cockpit operations. However, knowing how and when to use digital tools vs. paper backups ensures resilience in planning and in-flight decision-making.
Digital Charts: Advantages
- Live updates with data layers (winds aloft, NOTAMs, radar).
- Integrated planning with flight path overlays.
- Offline cache for in-flight reference.
Popular apps:
- Genesis PRO
- FlyQ+
- Garmin Pilot
- FltPlan Go
Paper Charts: When to Use
- Ideal for redundancy (battery/data failures).
- Useful in initial training or when instructing.
- Preferred for high-altitude route overview or backup enroute planning.
Summary: From Data to Decisions
Aviation weather charts offer more than regulatory compliance—they are your first line of defense in maintaining safety during cross-country operations. Mastering their use enables you to:
- Detect and mitigate enroute weather risks
- Identify viable alternates based on weather trends
- Plan fuel stops intelligently
- Minimize exposure to icing, turbulence, and convection
Remember, even the best-planned flights can face unexpected changes. But a pilot who is proficient in chart interpretation is far better equipped to adapt and adjust safely.